Graphing

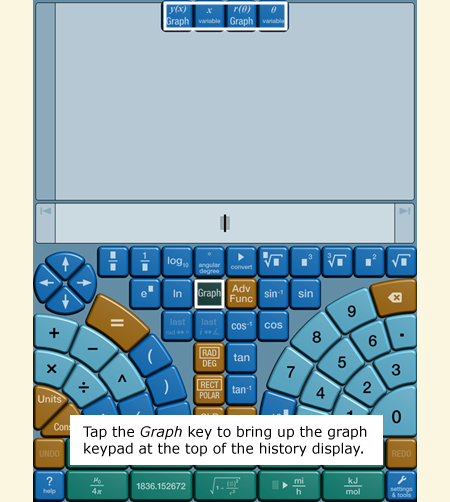
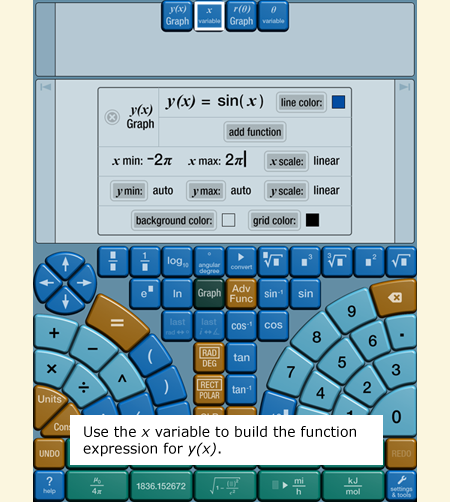
Numerari supports powerful but easy-to-use graphing for functions on rectangular and polar grids.
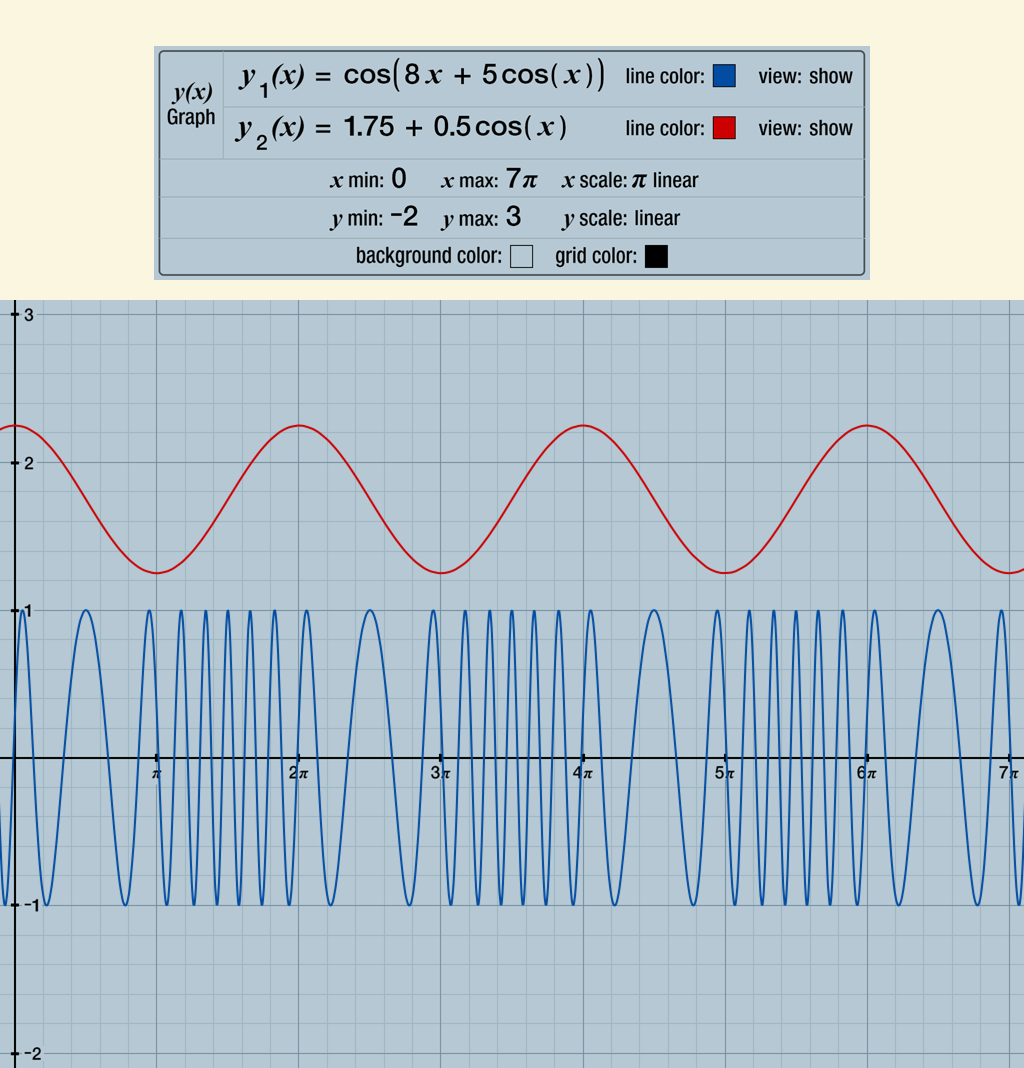
Choose from five scales for labeling the axes: regular linear (default), pi linear, regular logarithmic, and two special logarithmic decibel (dB) scales. The pi linear scale labels the axis in multiples of pi for functions with behavior that depends on pi.
Choose from six scale combinations: linear-linear, linear-log, log-linear, log-log, linear-decibel, log-decibel. The linear scales can be regular linear or pi linear, and the decibel scales can be 20 log or 10 log.
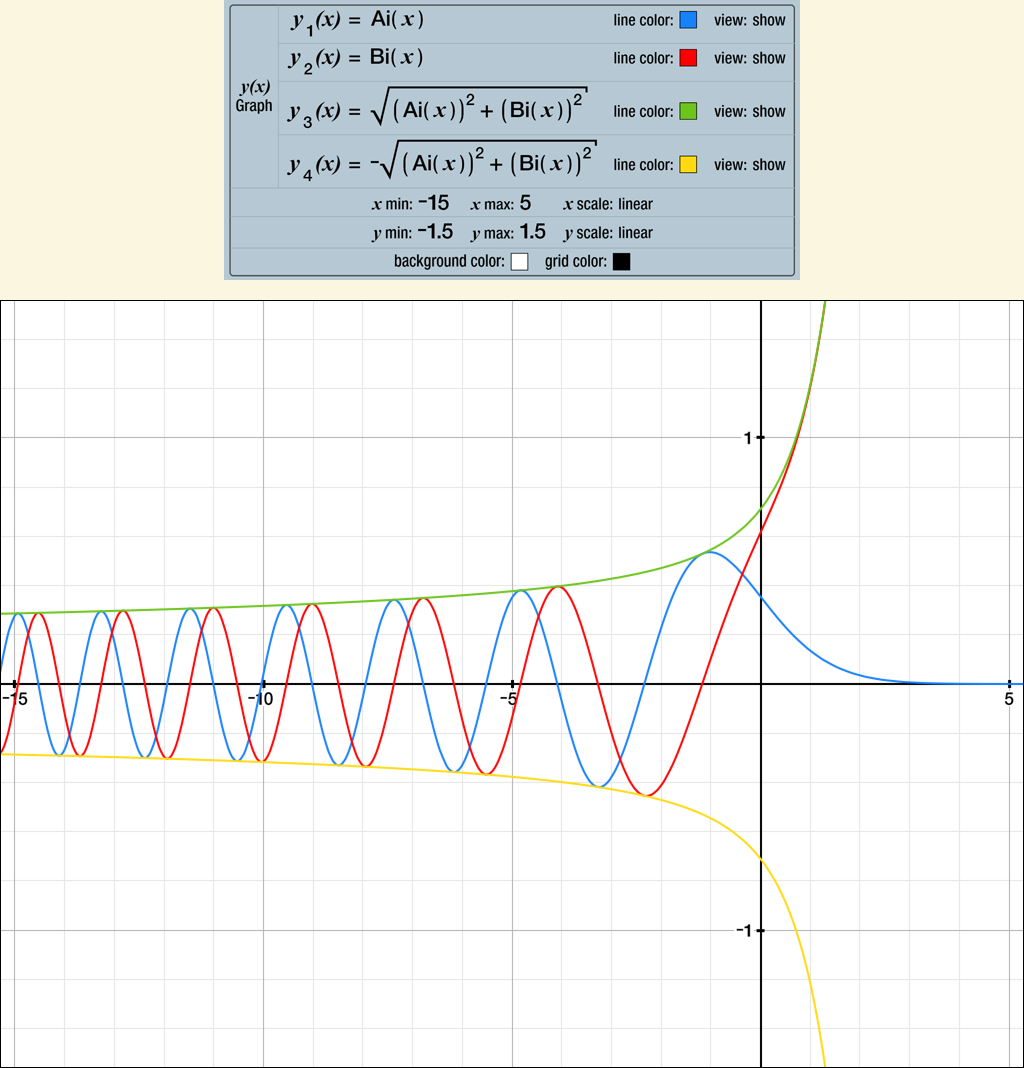
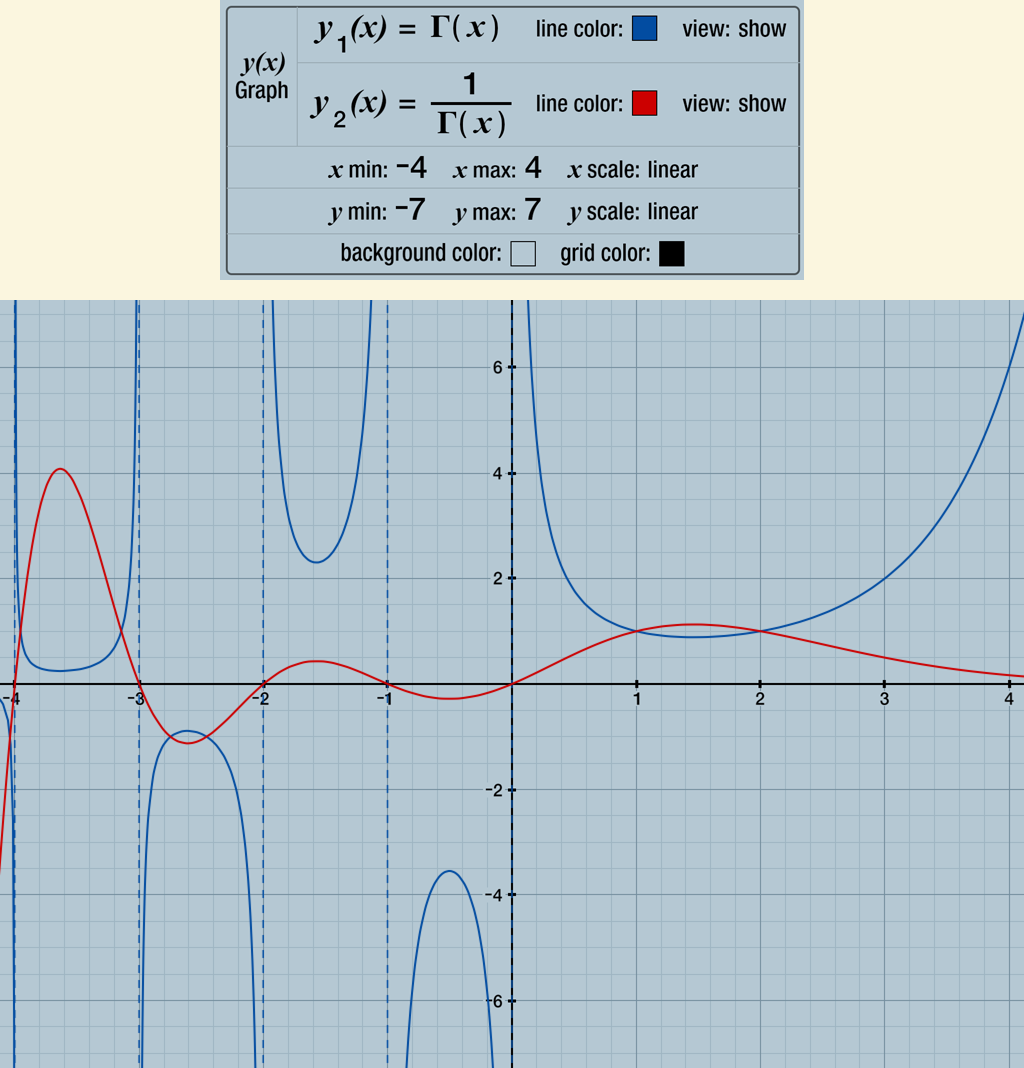
Graph multiple functions with different line colors.
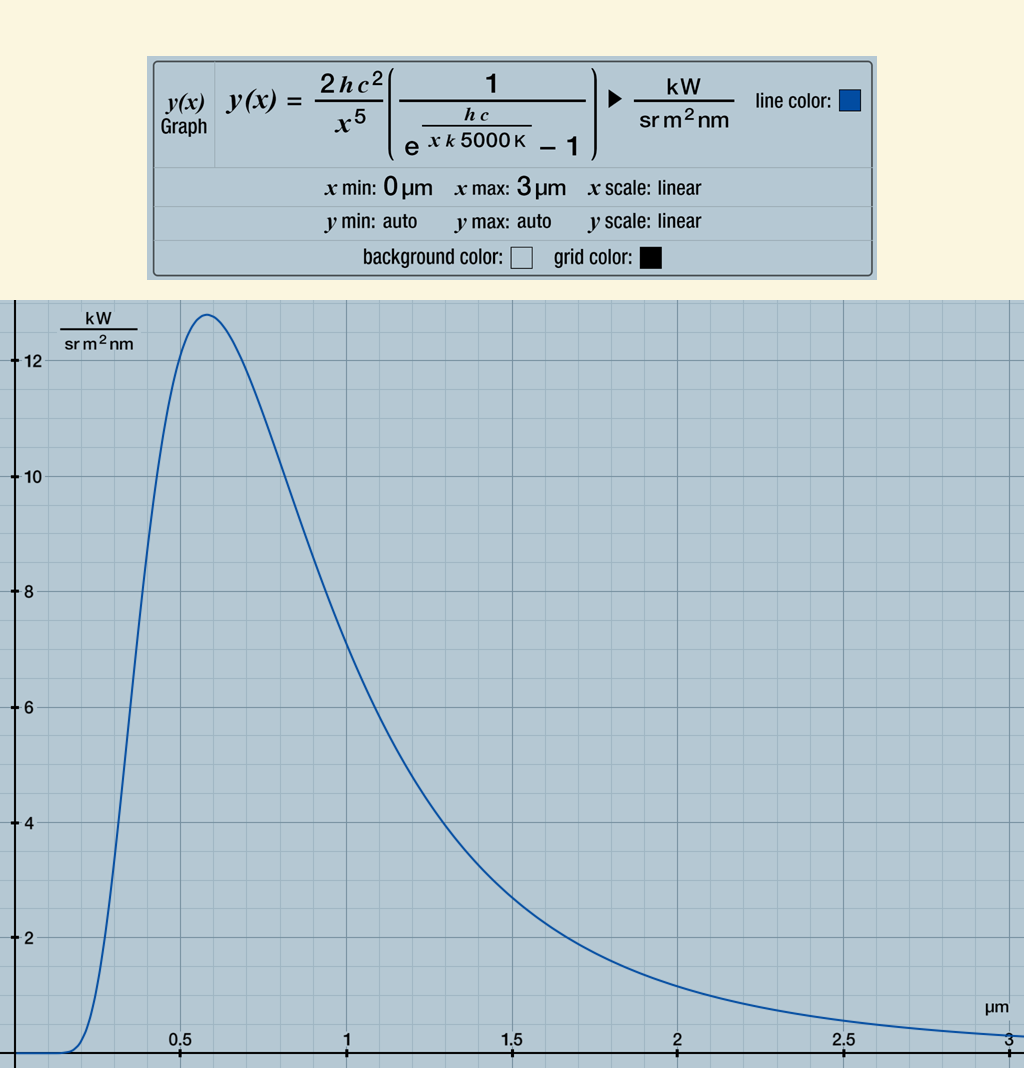
Units are fully integrated—use units in your function expressions and on your axes limits. All unit conversions for multiple functions and axes limits are handled automatically.
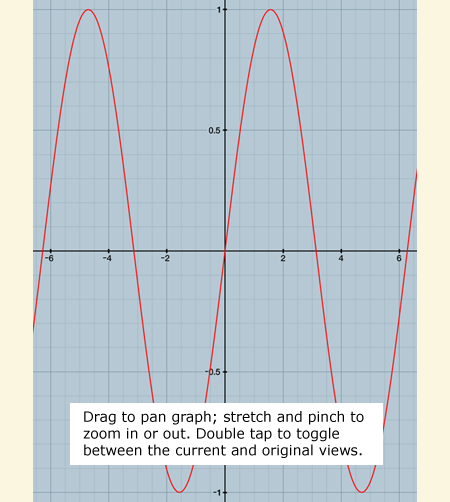
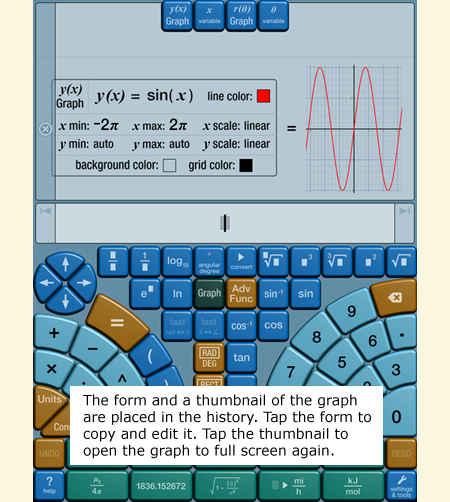
Expand a previous graph to full screen with just a tap of its thumbnail in the history display.
Copy and edit previous graph specification forms from the history display to create similar graphs.


Rectangular Grid Examples
(Click image to see full resolution)


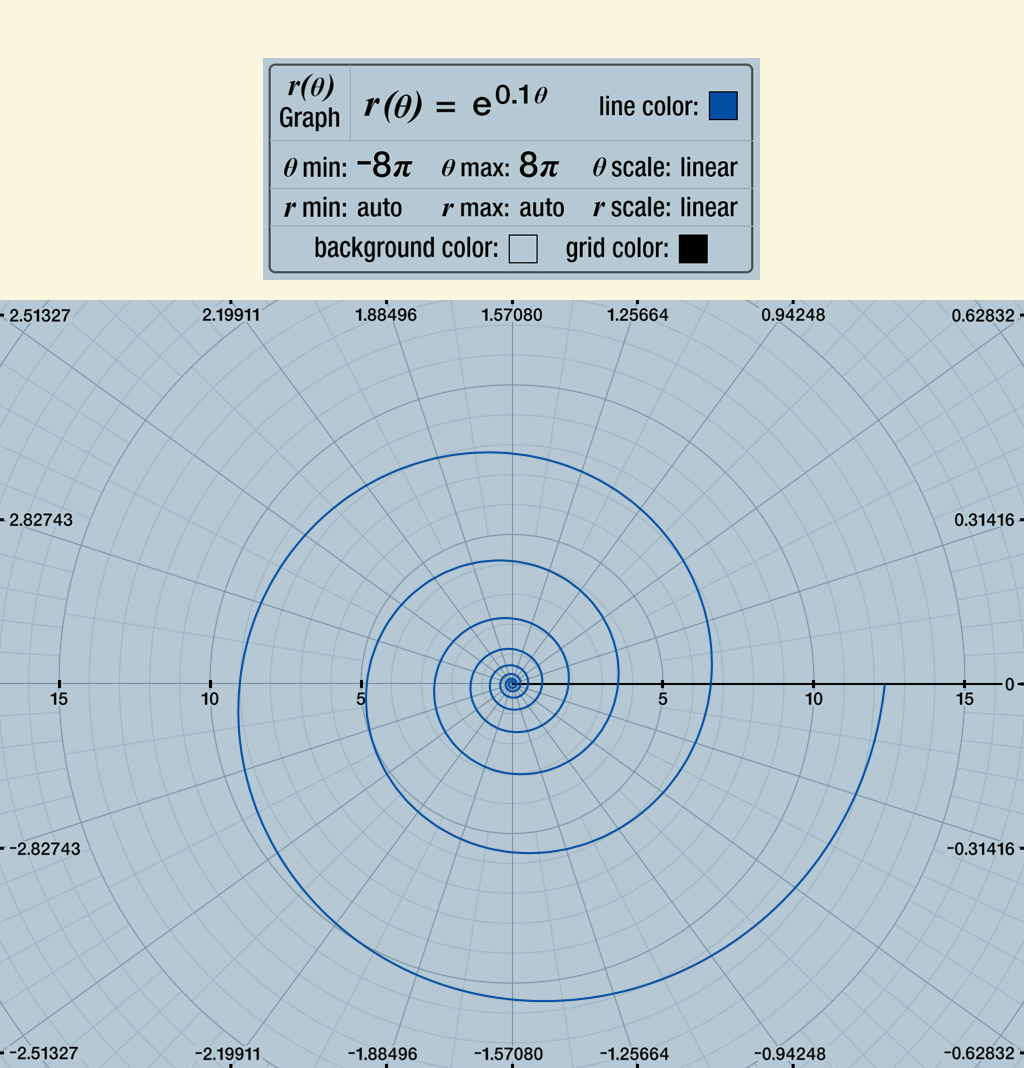
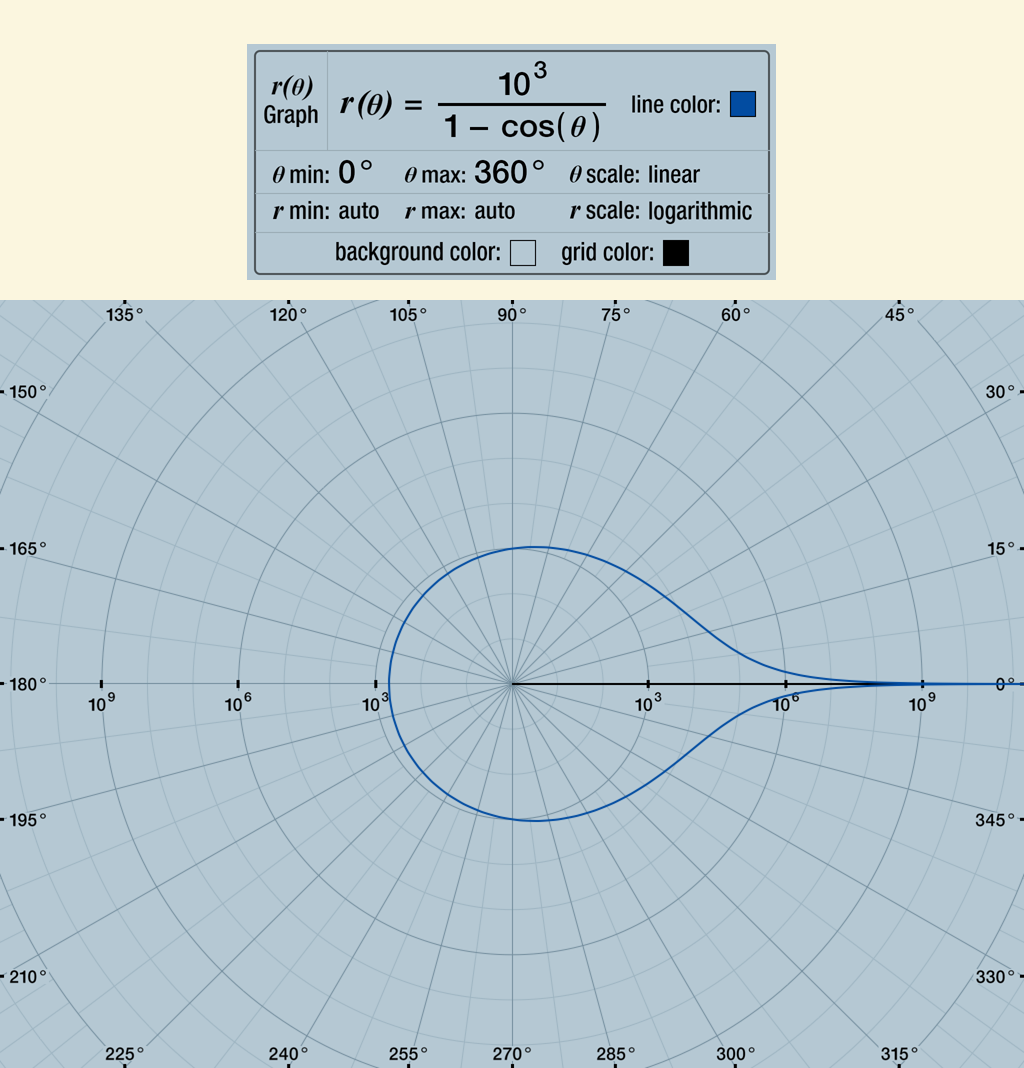
Polar Grid Examples
(Click image to see full resolution)


Color Examples
(Click image to see full resolution)